Telling cities’ stories
The City Fund partners directly with civic governments to help to support and design innovate non-profit school systems. They came to us with a mostly-finished website and brand book that they were unhappy with and wanted something new built. We engaged to design & develop a brand new site to launch the Fund’s public presence.
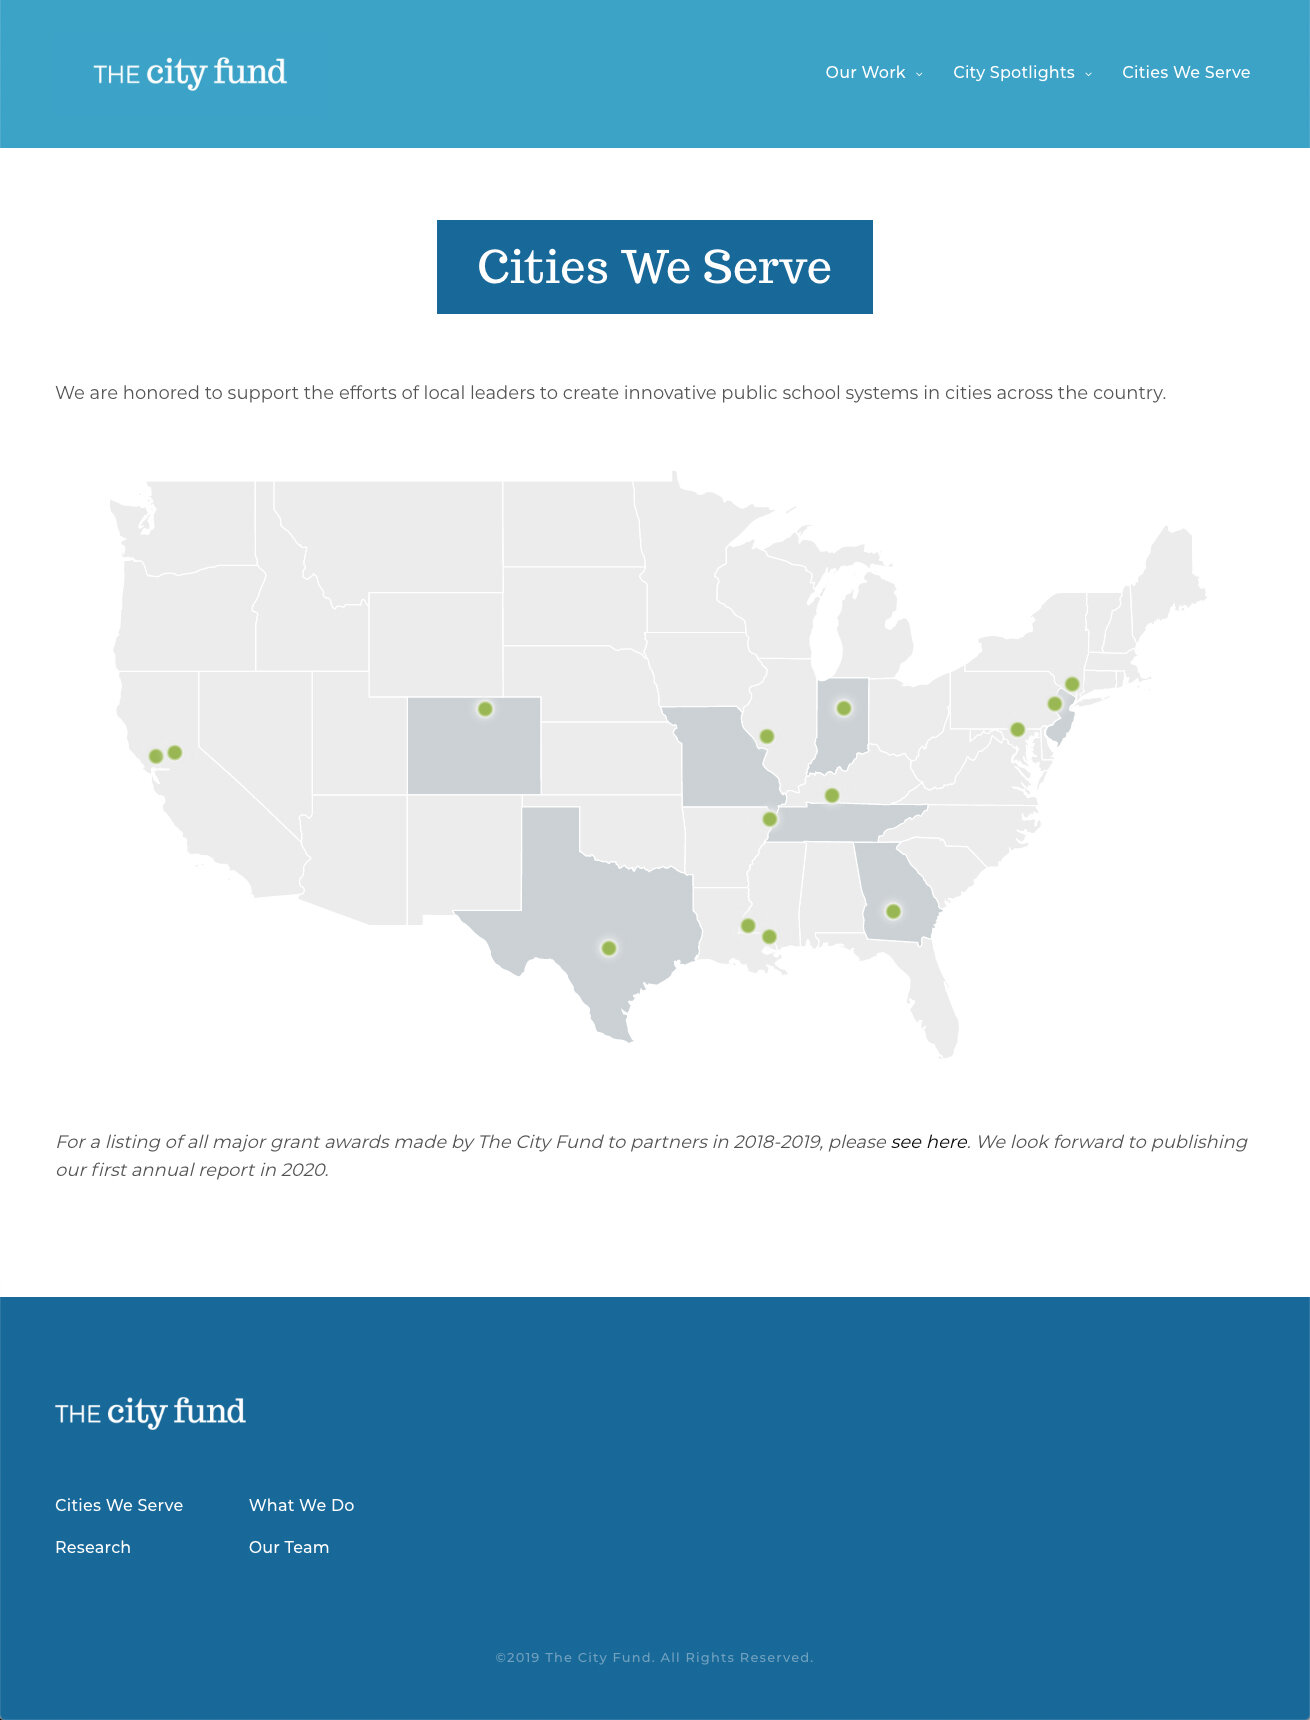
Our first instinct, having heard about their mission, was to build the site around the stories of the cities themselves. The Fund’s focus is improving the life outcomes for students at the level of the city, not at any specific school. So, we partnered with them to pull together the best data-driven stories we could for five cities: Washington D.C., New Orleans, Indianapolis, Newark, and Denver.
SERVICES
design
development
creative direction
data visualization
research
wordpress
Data visualization & research
The City Fund, of course, had all the data that anyone might need in order to compose these stories. However, no one had yet sifted through it all to put one together. So, working with their team, we drafted data-driven cases for the efficacy of the Fund’s policies in each of the cities. Then, once we had decided on the narrative high points, we created interactive data visualizations for each quantitative piece of the story. If we wanted to convince journalists and local policymakers - potential partners for the Fund - that the City Fund was doing good work for its partners, we needed to lay the case out in front of them.

Building towards the future
After lots of careful revision, we launched the site. We were careful while developing to make it easily editable, so the City Fund’s team can make updates themselves as their staff and reach grow. As more data comes in, we’ll be working with them to build out further city pages.